2016 University of the People Student Satisfaction Survey Results
Updated: June 19, 2024
Published: November 30, 2017

University of the People reviews from current students. Find out what makes 9 out of 10 happy & successful in workplaces despite a wealth of responsibilities.
Another year has passed, which means it’s time for another student satisfaction survey here at the University of the People.
We founded this online university to give people from all over the world access to higher education, and to support them in reaching their dreams. Therefore, it’s important for us to hear what our students, say about their experience with the university – what works for them and what needs to be improved – so we can keep making their time with us better and better.
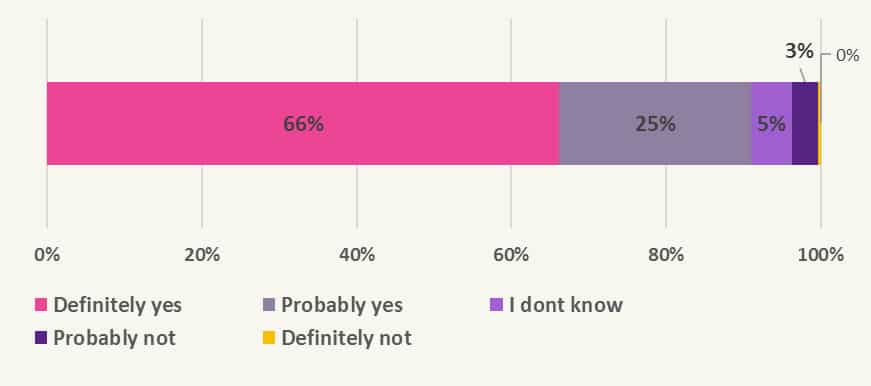
As in every year, we are humbled to see 95% of our students are satisfied with their experience at UoPeople – the majority are very satisfied – and that 91% are going to enroll again in the next term.
Figure 3: Overall Satisfaction with UoPeople
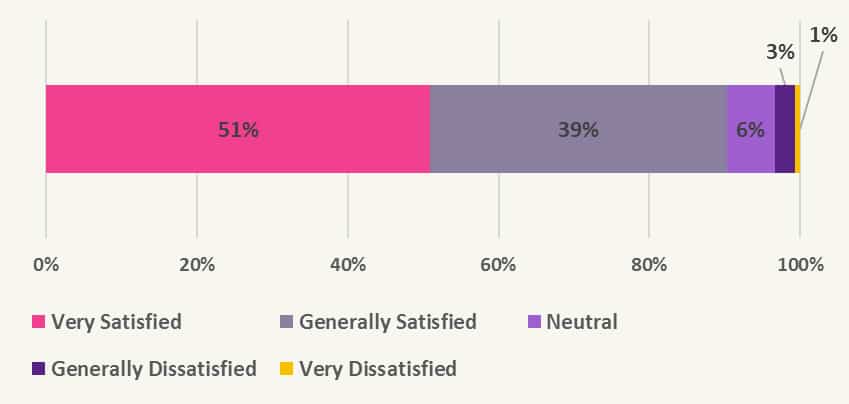
Figure 4: Likelihood of Enrolling Again in Program
But before we break down what they are satisfied with, let’s take into account who our students are and everything they have on their plates.
Meet the Students of the University of the People
We love the diversity of our students. around half are from North America while the other half are from the rest of the world. The average age at UoPeople is higher than the everyday university – 36.6-year-olds – with a quarter of the student population being over 40.
Since our students are older than the average offline university student, it’s not surprising that 92% of them are employed, with 64% working 31-40 hours or more every week.
Figure 22: Respondent Employment Status
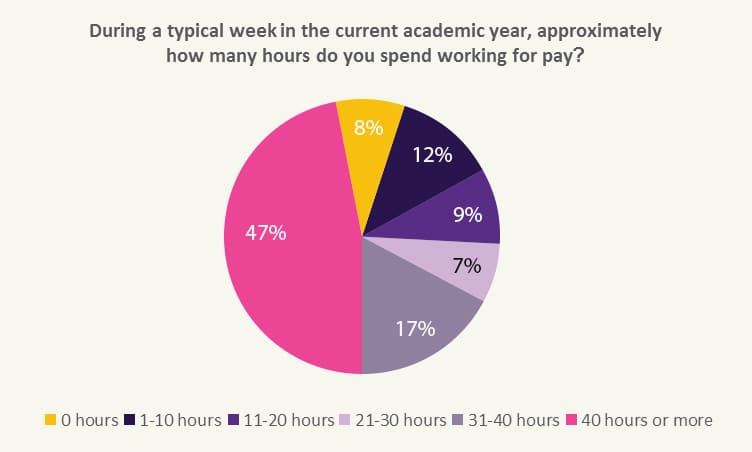
We assume the flexibility that we allow our students in choosing their own hours supports them to both keep their jobs and advance their future careers by getting a degree.
That, of course, becomes even more crucial when you look at students’ personal lives. 71% have children and/or other close relatives that they’re responsible for.
Figure 51: being responsible for significant other
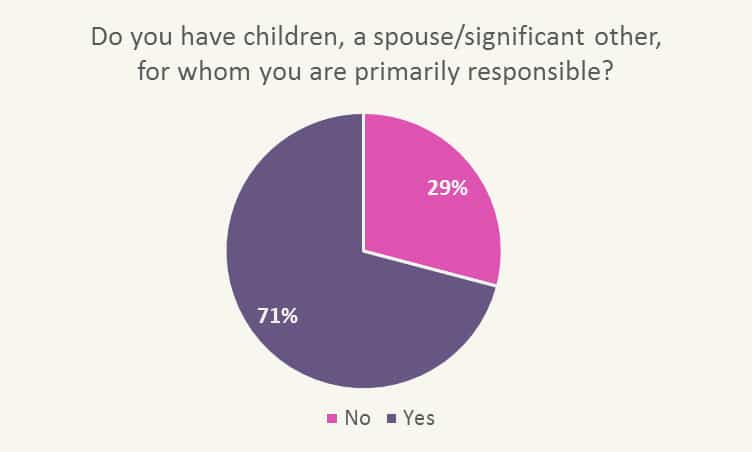
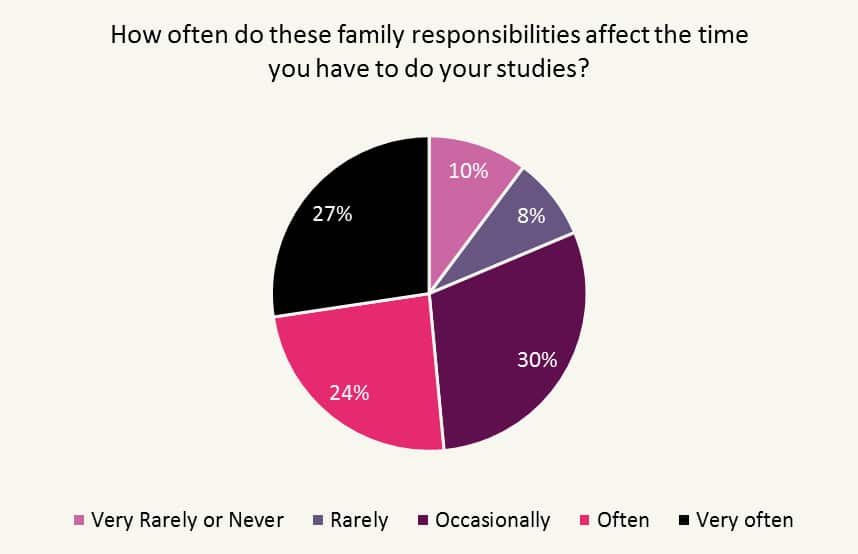
These family responsibilities affect the time students have to dedicate to their degrees. For 30%, these responsibilities sometimes affect them, but for 51%, these responsibilities affect them often or very often.
Figure 52: family responsibilities and their effect on studies
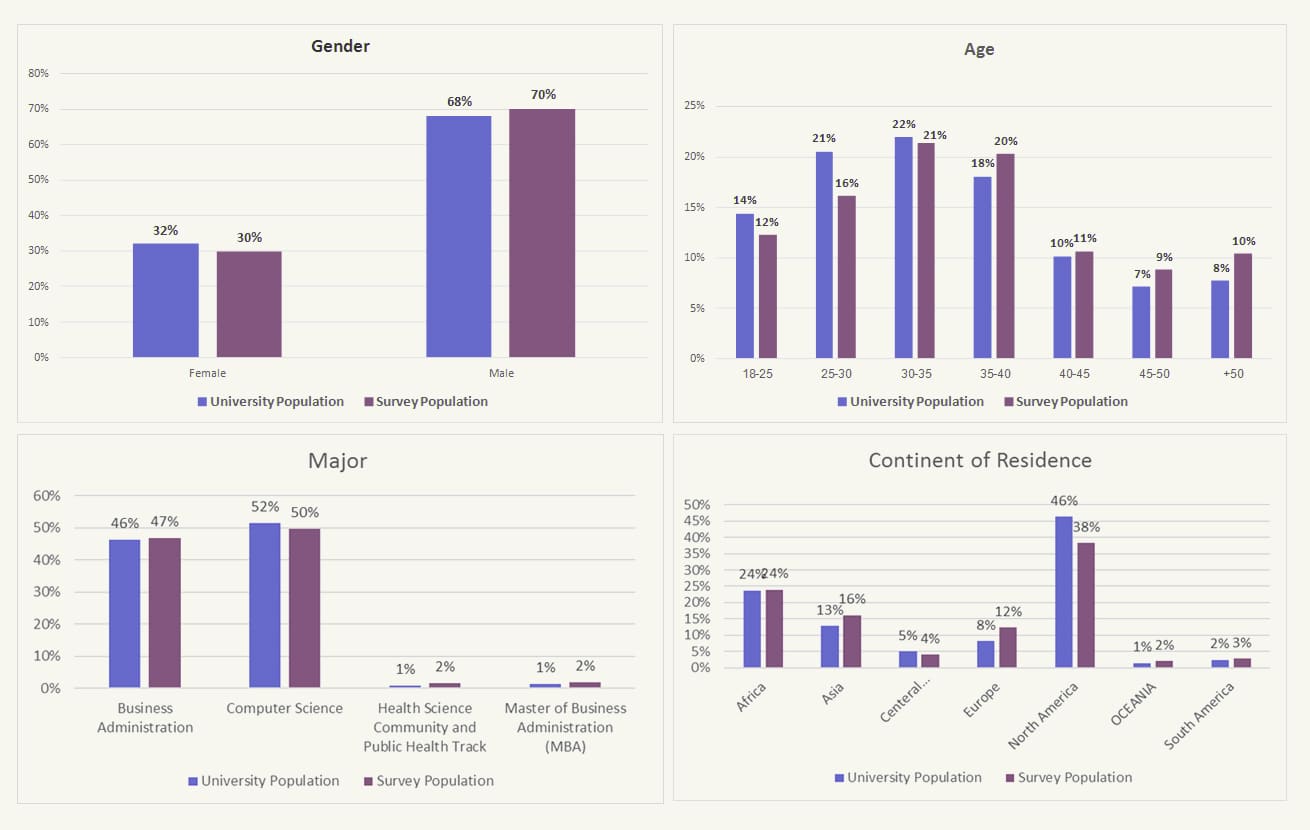
If you’re wondering what kind of programs make it worth their while, a big portion of our students study for an undergraduate in business administration and computer science.
Even though our MBA and Health Science Community and Public Health Track are brand new – the survey was conducted two terms after the programs launched – they already encompass 2% of our online campus.
Figure 1: Demographic Profile of the University Population Vs. the Survey Respondents
What Makes 9 Out of 10 Students Happy About their Choice of University? Here’s What UoPeople Students Had to Say
Now that we’re clear on who are students are, let’s break down what contributed to their satisfaction.
University of the People Students Love Going (We Mean Logging In) to School
This is one of our favorite parts of the survey year after year.
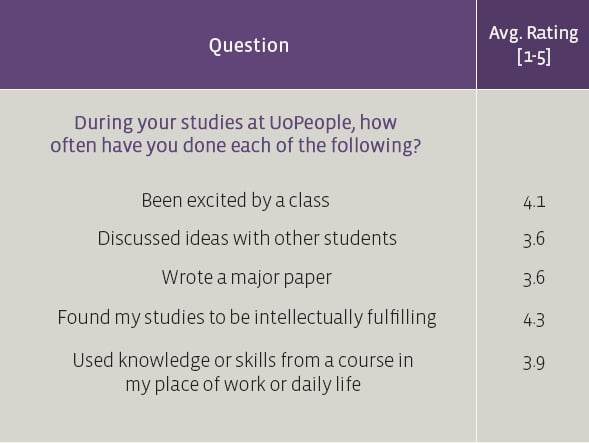
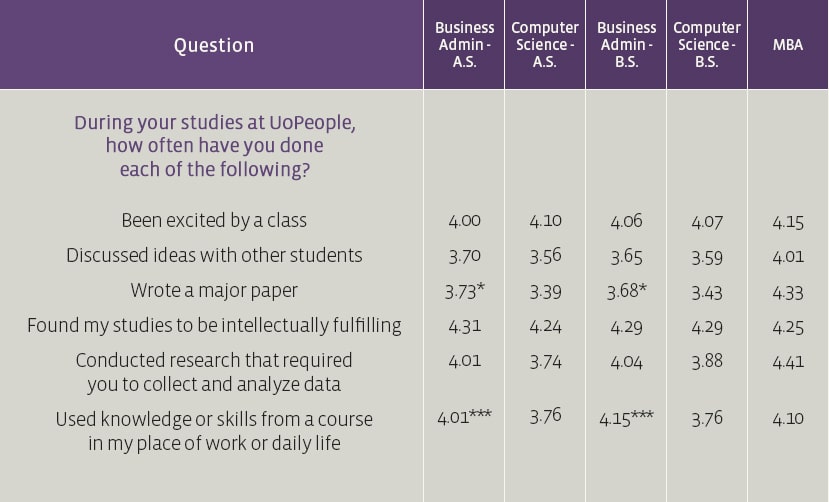
When asked to rank how often they’ve been excited by a class, University of the People students across all programs chose an average of 4.1 on a scale of 1-5, 5 being the highest.
One of the reasons for that? Students here often find their studies intellectually fulfilling. This element received an average grade point of 4.3 out of 5, with 5 being the highest.
Table 9: Frequency of Academically-related Experiences
University of the People Students Gain Important Skills that Contribute to their Workplace Success
When asked to what extent their experience at the University of the People contributed to their knowledge, skills and personal development, the ability to learn on their own received the highest grade – 4.3 on a scale of 1-5, with 5 again being the highest.
Table 11: Educational Gains
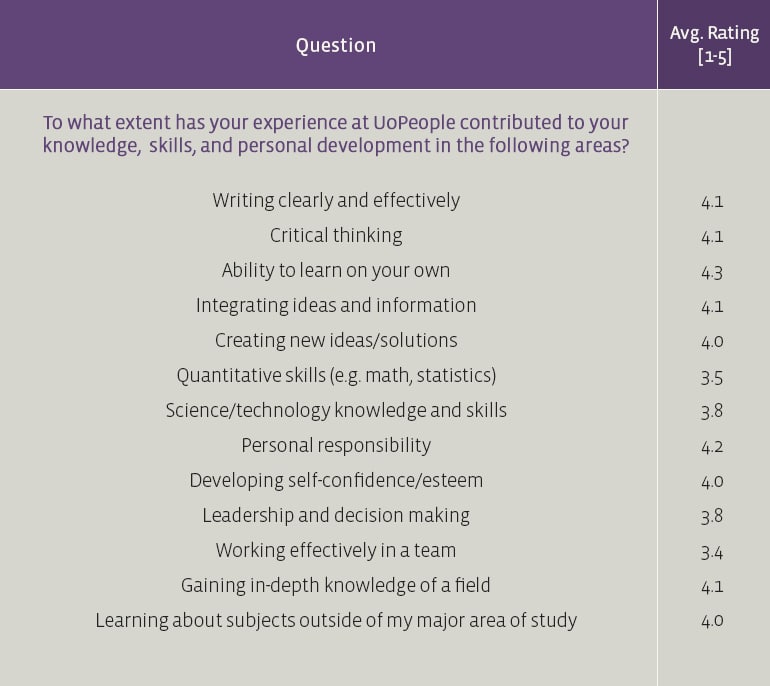
Many other skills were acknowledged, including writing clearly and effectively and integrating ideas and information.
Impressively, many students find that their studies here provide them with work-related knowledge and skills – and many use the knowledge and skills gained in courses in their workplaces.
Table 12: Educational Gains by Degree Level and Major Area of Study
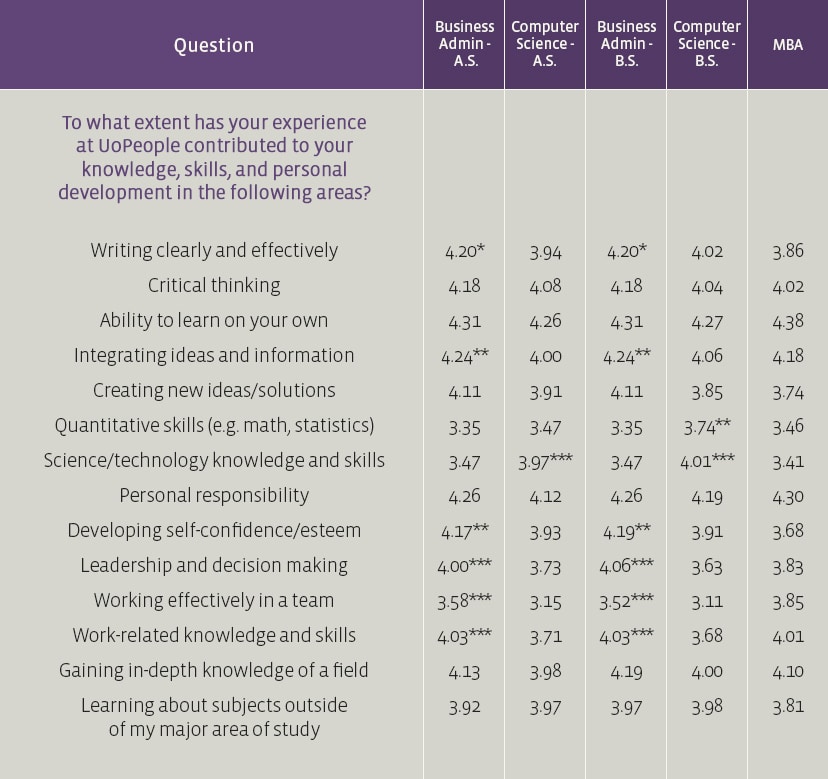
# ANOVA test lunch only among undergraduate students.
Table 10: Frequency of Academically-related Experiences by Degree Level and Major Area of Study
University of the People Students Grow as Leaders While Developing Team Work Skills
As you can see above, many students believe their studies with the University of the People contribute to developing self-confidence and self-esteem, as well as provide leadership and decision making skills – while also helping them learn how to work more effectively in teams.
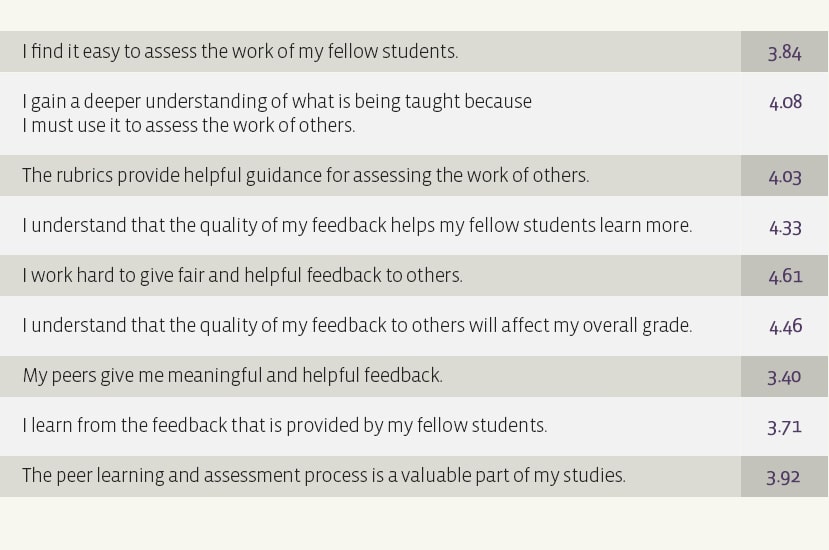
As you’ll see below, students are required to assess their peers’ work and learn how to do so despite the vastly different multicultural background in every class. Students believe that this assessment is a valuable part of their studies – they gain a deeper understanding of what’s being taught because they must use their new knowledge and skills to assess their peers’ work.
Table 54: Peer assessment evaluation
University of the People Students Provides Knowledgeable and Helpful Advisors on a Wide Range of Topics
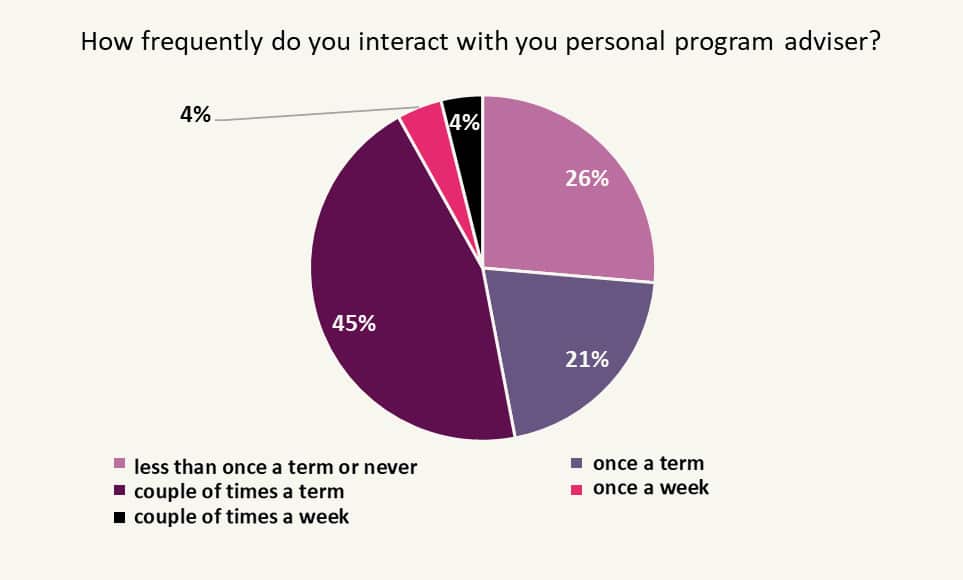
We try to make everything as simple as possible for our students, and the survey reveals that 81% of them only needed help from their personal program advisor twice a term, or less.
Figure 5: Frequency of Interacting with Program Advisors
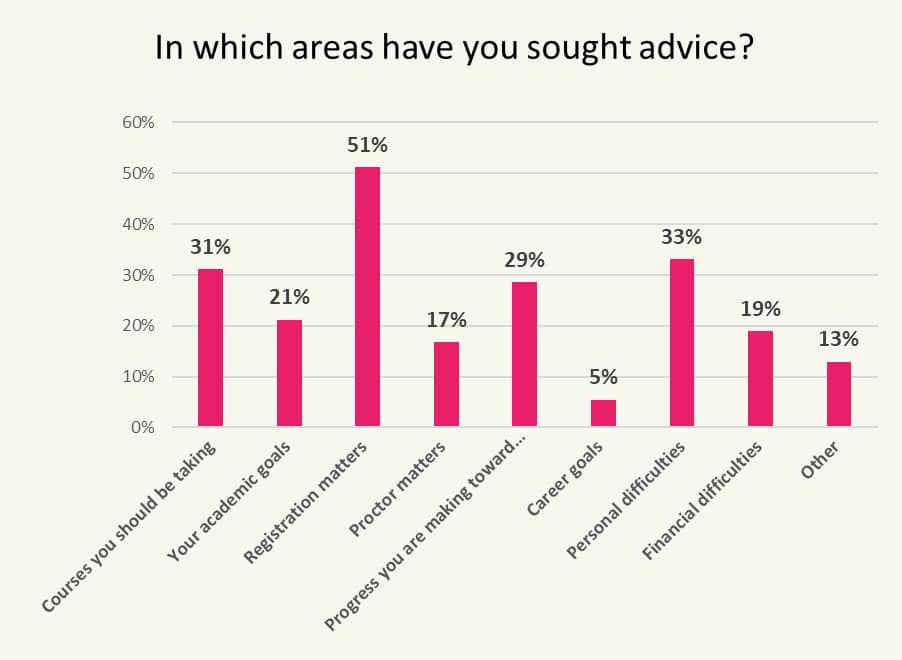
Out of those that do seek out support, 51% get help with registration matters, and 33% feel comfortable enough with their advisors to consult on personal difficulties.
Figure 6: Types of Advice Sought by Students
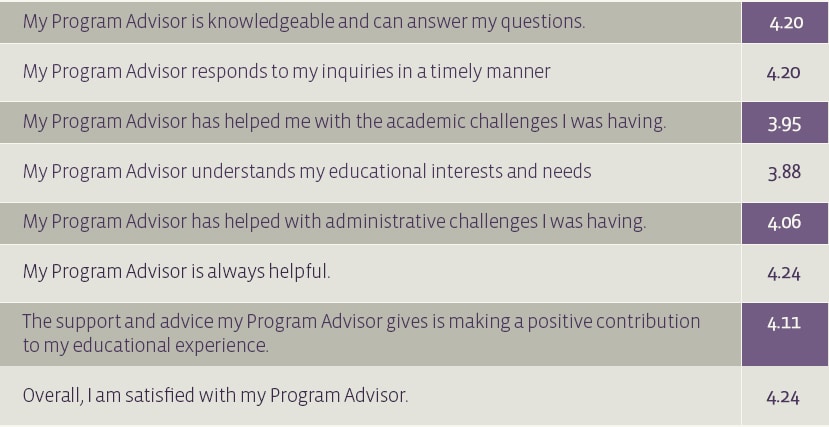
…but the overall notion is that students are satisfied with their program advisors (ranked 4.24 out of 5, with 5 being the highest), and find these program advisors knowledgeable and helpful (ranked 4.20 out of 5).
Table 16: Rating of Interactions with Program Advisors
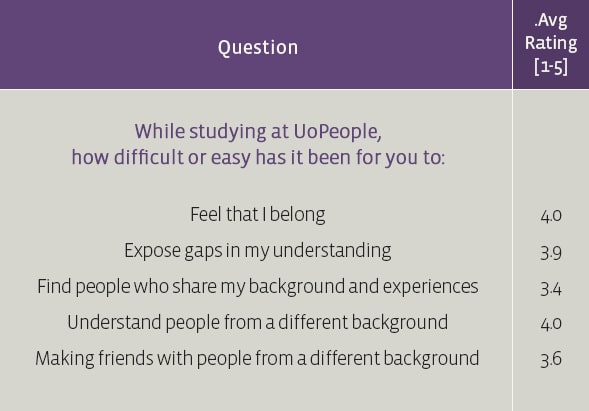
Despite the differences, most students feel like they belong and like it was easy for them to understand people from different backgrounds.
Both aspects ranked 4 out of 5, with 5 being the highest.
Table 13: Self-perceptions of Fit
By Helping Students Achieve Their Goals, We’ve Achieved Ours
An astounding 94% of students are satisfied with their experience at the University of the People…
Figure 55: Overall satisfaction
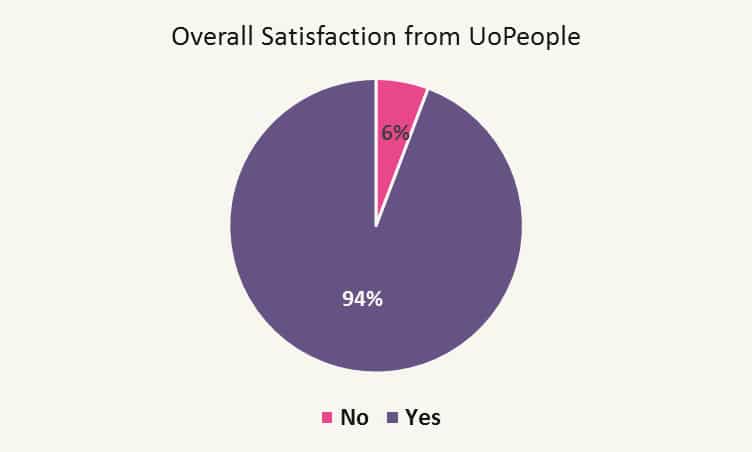
All things considered, are you satisfied with your studies with UoPeople?
… and 92% feel that they’ve achieved the goals they’ve set for themselves.
Figure 56: Goal Achievement
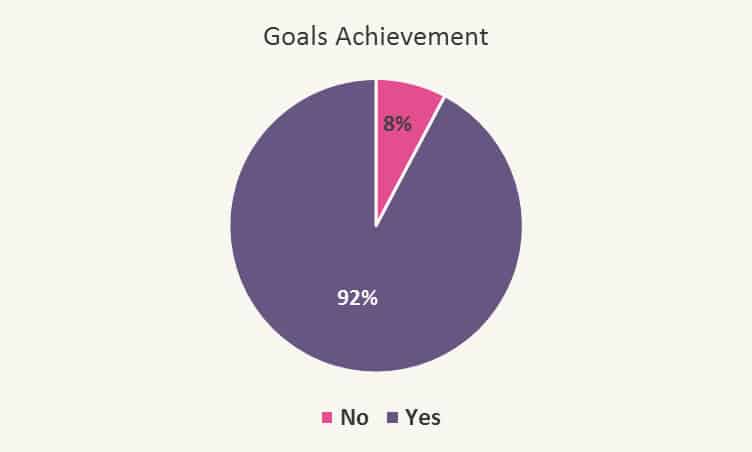
Did you achieve, or will you have achieved upon completing your studies, the goals you had when you started this course or program?
Therefore, 95% would recommend the University of the People to a friend.
Figure 57: Recommendation
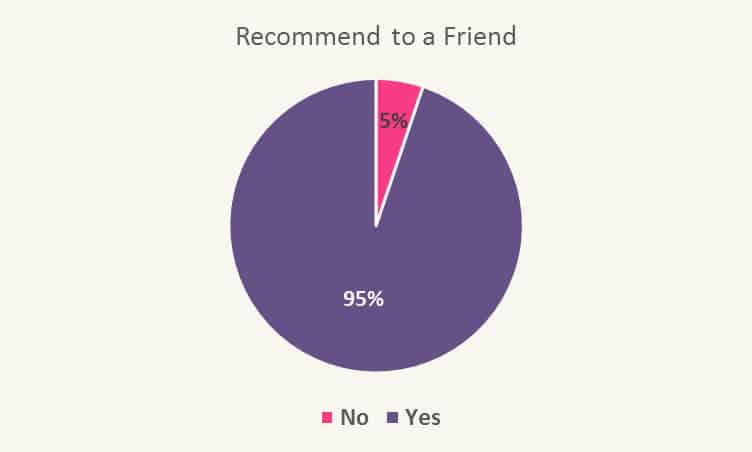
Would you recommend these studies to a friend?
As we said at the beginning of this article, our dream for this university was to contribute to an equal world, where everyone can have access to higher education, which you can leverage toward becoming the person you’ve always wanted to be and living the life you’ve always wanted to love.
We want to thank our students for helping us make this dream a reality, and for taking the time to share their experience with us.
We believe in our students and can’t wait to meet them in the next class. We’ll keep working, as always, to help them realize their dreams.